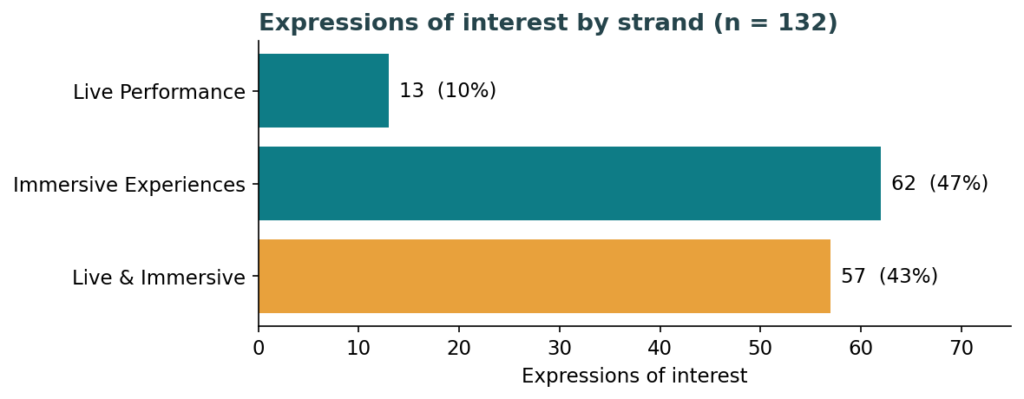
Live & Immersive Innovation Fund was the second CreaTech Frontiers funding call, which invited Expressions of Interest (EOIs) for grants of £25,000 across Live Performance and Immersive Experiences. A total of 232 applicants registered for the call, of whom 132 went on to submit an EOI — a conversion rate of 57%. This is slightly higher than the 52% conversion seen in the Foundations call (480 registered, 252 submitted), suggesting that the larger grant size and more focused scope attracted applicants more likely to follow through with an application.
Immersive Experiences attracted the most EOIs with 62 (47%), followed closely by EOIs combining Live Performance and Immersive Experiences with 57 (43%). The Live Performance strand on its own received just 13 EOIs (10%). Figure 1 shows the distribution.
Success Rates
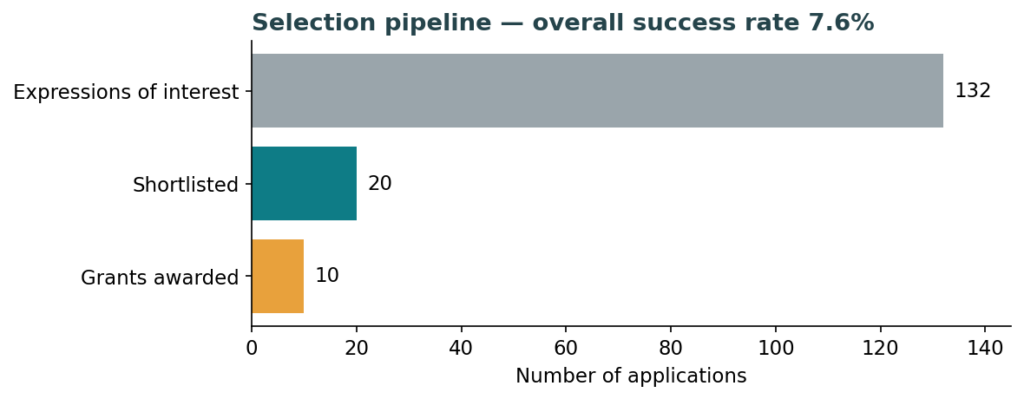
Of the 132 submitted EOIs, 20 were shortlisted (15.2%), and 10 were ultimately awarded grants. The overall success rate for the call was therefore 7.6% of submitted EOIs, while 50% of shortlisted applicants went on to receive funding. Figure 2 shows the selection pipeline.
This is a markedly more competitive round than the Foundations call, where 35 of 251 applications were funded — a success rate of 13.9%. Given the larger awards (£25,000 versus £5,000 to £10,000), and the smaller number of grants awarded, a lower success rate was to be expected.
Who Applied?
Companies dominated the applicant pool. Of the 132 applicants, 97 (74%) applied as companies and 35 (26%) as freelancers. Looking at applicants’ roles within their organisations, founders and owners made up the largest group with 79 responses (62%), followed by freelancers (28, 22%), permanent staff (10, 8%) and those describing their role as other (10, 8%). One respondent was a board member.
Table 2: Applicant’s role (n = 128 responses).
| Role | # Applicants | % |
| Founder/Owner | 79 | 61.7 |
| Freelancer | 28 | 21.9 |
| Permanent staff | 10 | 7.8 |
| Other | 10 | 7.8 |
| Board member | 1 | 0.8 |
| Prefer not to say | 0 | 0.0 |
Prior public funding. Applicants to this call were evenly split on whether they had previously received public funding: 65 (49%) had, and 67 (51%) had not. This contrasts with the Foundations call, where only 35% of applicants (87 of 251) had prior public funding — consistent with the larger grant size attracting a more experienced applicant pool.
Where in the West Midlands?
Birmingham accounted for over half of all EOIs with 70 (53%), followed by Coventry (17) and Warwickshire (12). Together these three areas contributed 75% of applications. Figure 3 and Table 3 show the full breakdown. Notably, Warwickshire’s share fell sharply compared with the Foundations call (12 EOIs versus 50 applications), while this time no EOIs were received from Telford & Wrekin.
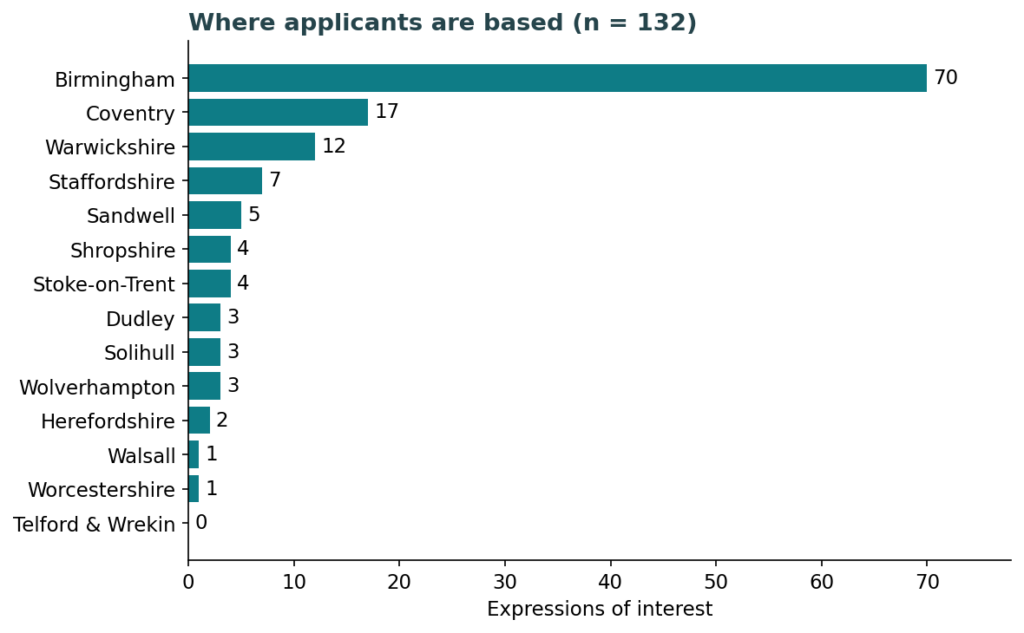
Table 3: A full breakdown of where applicants are based, ordered by number of EOIs, with the Foundations call for comparison.
| Local authority | # EOIs (L&I 2026) | # Applications (Foundations 2025) |
| Birmingham | 70 | 98 |
| Coventry | 17 | 31 |
| Warwickshire | 12 | 50 |
| Staffordshire | 7 | 10 |
| Sandwell | 5 | 5 |
| Shropshire | 4 | 2 |
| Stoke-on-Trent | 4 | 11 |
| Dudley | 3 | 6 |
| Solihull | 3 | 9 |
| Wolverhampton | 3 | 11 |
| Herefordshire | 2 | 2 |
| Walsall | 1 | 2 |
| Worcestershire | 1 | 10 |
| Telford & Wrekin | 0 | 4 |
Applicant Demographics
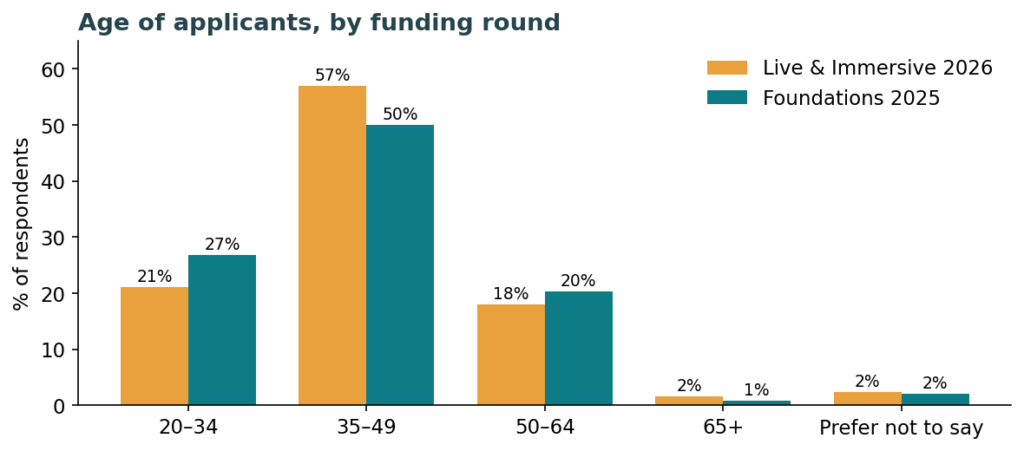
Age. The applicant pool was concentrated in mid-career: 57% of respondents (73 of 128) were aged 35–49, with 21% aged 20–34 and 18% aged 50–64. Only two respondents were 65 or over. As Figure 4 shows, this is a somewhat older profile than the Foundations call, where 27% of respondents were aged 20–34.
Gender. Applicants were 45% female and 50% male, with nonbinary, transgender and self-describing applicants together making up around 5%, alongside a small number preferring not to say. The Foundations call was marginally more balanced (47% female, 48% male).
Disability. 23% of applicants identified as disabled — up from 18% in the Foundations call — with 67% not identifying as disabled and 10% preferring not to say.
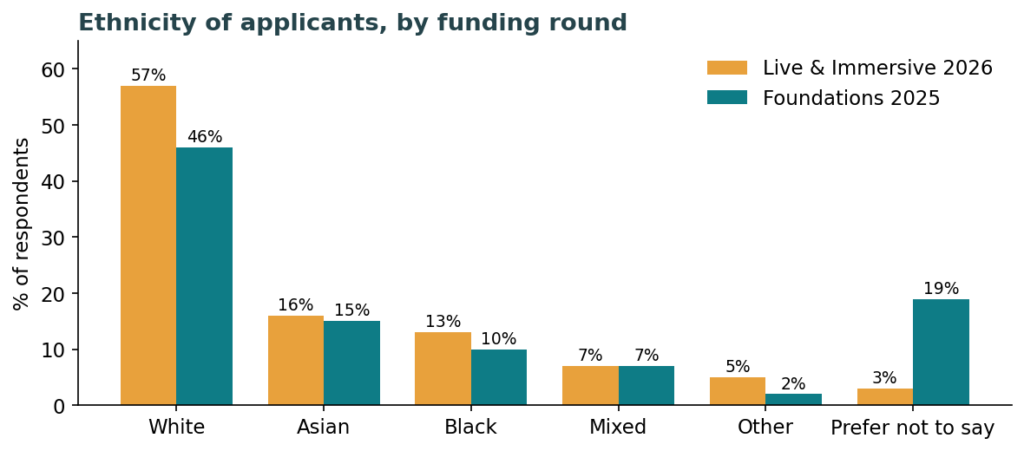
Ethnicity. 57% of respondents identified as White, 16% as Asian, 13% as Black, 7% as Mixed and 5% as another ethnicity, with 3% preferring not to say. Direct comparison with the Foundations call is made difficult by a higher non-response (19% preferred not to say), but the share of applicants from Black, Asian and minority ethnic backgrounds — around 41% — remains substantial in both rounds. Figure 5 shows the comparison.
The process
Every EOI was reviewed by pairs of experts – one academic with relevant expertise in the EOI’s specialist domain, and one innovation expert. The review consisted in scoring three questions that the EOI needed to address around the proposed innovation (50% of the total score), and the potential for economic (25%) and social (25%) impact.
The minimum average score (the combined scores of the two reviewers) was 36.3%, and the highest average score was 97.5%. The lowest scored EOI that progressed to the next stage received an average score of 78.8%, whilst the highest scored EOI that did not progress received an average score of 87.5%.
The next stage was an audit of the review process carried out by a panel formed by the CreaTech Frontiers leads for responsible innovation, EDI and sustainability, to highlight any potential inconsistency, ethical concerns or the need for a supplementary review. The panel looked at all submitted EOIs. After this stage was concluded, the EOIs that scored an average of 80 or more were considered by a panel that included independent industry members. The panel was tasked with selecting the 20 EOIs that should progress to full application. As the final stage of the process the 20 shortlisted applicants were invited to prepare a presentation, budget and business plan, and to attend an interview with a panel composed by the Director of CreaTech Frontiers, two members of the cluster’s management team and one industry partner representative. At the end of the process ten applications were recommended for funding.